Splunk Explained: From Raw Machine Data to Searchable Insights
Modern IT environments generate an enormous amount of machine data. Servers write logs, applications produce events, firewalls record network activity, cloud platforms emit telemetry, authentication systems record user actions, and security tools generate alerts. The difficult part is not collecting this information. The difficult part is turning it into something searchable, measurable, and useful.
That is where Splunk fits.
Splunk is a data platform used to ingest, index, search, analyze, visualize, monitor, and investigate machine-generated data. It is widely associated with log analysis and security operations, but its use cases extend into IT operations, application monitoring, observability, business analytics, incident response, and operational intelligence.
For students, Splunk is particularly valuable because it combines several areas of computing in one practical environment: networking, operating systems, databases, distributed systems, cybersecurity, data analytics, regular expressions, visualization, and query design.
This makes Splunk projects interesting—but also challenging.
A typical university task may ask you to ingest logs, identify failed authentication attempts, write SPL searches, extract fields, create a dashboard, configure an alert, and explain the findings. A strong submission therefore needs more than a working query. It needs a clear understanding of how data moves through Splunk, how searches operate, and how technical results should be interpreted.
1. What Is Splunk?
Splunk is a platform for working with machine-generated data.
The basic idea is straightforward:
Machine Data
    ↓
Collect
    ↓
Index
    ↓
Search
    ↓
Analyze
    ↓
Visualize
    ↓
Act
Machine data can come from many sources, including:
- Servers and operating systems
- Web and application logs
- Firewalls and intrusion-detection systems
- Network devices
- Authentication systems
- Databases
- Cloud services
- Containers and infrastructure
- Security products
- Custom applications
- IoT and other connected systems
Instead of forcing an analyst to open every log file individually, Splunk provides an environment where data can be centralized, indexed, searched and transformed into useful results.
That makes Splunk relevant to several academic subjects:
- Cybersecurity
- Data analytics
- Networking
- Cloud computing
- DevOps
- Software engineering
- Distributed systems
- Database and information systems
For a student learning Splunk, the most useful mental model is not "Splunk is a log viewer." It is a platform that turns large volumes of machine data into searchable events and analytical results.
2. How Splunk Works: The Core Architecture
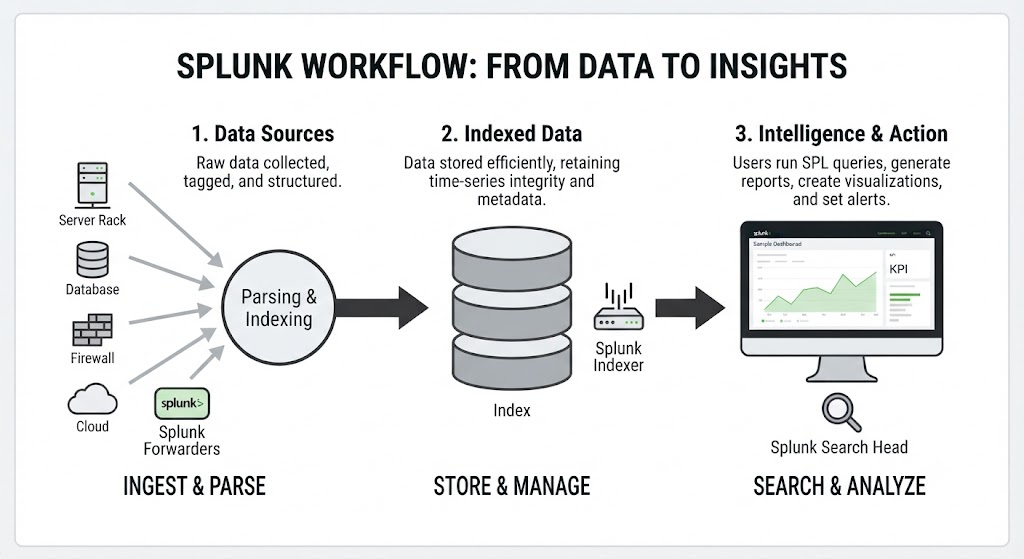
A basic distributed Splunk architecture can be understood through three major roles:
Data Sources
     ↓
Forwarders
     ↓
Indexers
     ↓
Search Head
     ↓
Users / Dashboards / Alerts
The exact architecture can become much more sophisticated in large deployments, but this model is extremely useful for learning.
Data sources
Data sources generate the information that Splunk will analyze.
Examples include:
- Linux authentication logs
- Windows events
- Web server access logs
- Firewall events
- Application logs
- Cloud telemetry
- Database logs
Forwarders
Forwarders collect and send data toward the indexing tier.
The Universal Forwarder is designed primarily for data forwarding. It is lightweight and does not provide the full search and indexing capabilities of a complete Splunk Enterprise instance.
A Heavy Forwarder can perform more processing and routing than a Universal Forwarder and can be useful when data requires additional handling before reaching indexers.
Indexers
Indexers receive, process and store incoming data. They create searchable indexes and respond to search requests from the search tier.
In a distributed deployment, multiple indexers can work together to provide scale and resilience.
Search heads
A search head provides the interface through which users run searches and work with results. In distributed searching, it coordinates searches across indexers and combines results.
This architecture is important in Splunk architecture assignments because it demonstrates the difference between data collection, data storage/search, and user-facing analysis.
3. Data Ingestion: Where a Splunk Project Really Begins
Many beginners start with SPL queries.
That can be a mistake.
If the data is not being ingested correctly, even a perfect search can return poor results.
A good Splunk workflow therefore starts with understanding:
What data do I have?
        ↓
Where does it come from?
        ↓
How should it be collected?
        ↓
Which index should contain it?
        ↓
What sourcetype describes it?
        ↓
Which fields should be searchable?
Splunk automatically associates events with important fields such as host, source, and sourcetype.
These fields are fundamental to search design.
For example:
index=web sourcetype=access_combined
is much more informative than an unrestricted search across everything.
This is also why Splunk assignment help should not focus only on writing SPL. A good solution explains the data model and ingestion choices behind the query.
4. Indexes, Sources and Sourcetypes
Three concepts frequently confuse new Splunk users:
indexsourcesourcetype
They are related, but they are not interchangeable.
Index
An index is a logical location where Splunk stores and organizes indexed data.
Example:
index=security
Source
The source identifies where an event originated, such as a file path or network input.
Example:
source="/var/log/auth.log"
Sourcetype
The sourcetype describes the format or type of incoming data and helps Splunk interpret events.
Example:
sourcetype=linux_secure
A useful conceptual distinction is:
index      → Where the data is stored
source     → Where the event came from
sourcetype → What kind of data it is
Understanding these distinctions is essential for Splunk log analysis, troubleshooting and efficient SPL searches.
5. Search Processing Language (SPL)
The heart of practical Splunk work is Search Processing Language, commonly called SPL.
SPL allows users to retrieve events, filter results, extract information, calculate values, aggregate data, create tables, generate charts and perform analytical operations.
The pipe character is central to SPL:
search | command1 | command2 | command3
The output from one stage becomes the input to the next.
For example:
index=security sourcetype=linux_secure
| stats count by user
| sort - count
Conceptually, the search does three things:
- Retrieves security events.
- Counts events for each user.
- Sorts users by event count.
This pipeline-based approach is one of the most important concepts to understand when preparing a Splunk SPL assignment.
6. Essential SPL Commands Students Should Know
A strong Splunk tutorial for beginners should cover more than simple searches.
search
Used to filter events.
index=web status=404
stats
One of the most important commands for aggregation.
index=web
| stats count by status
You can also calculate averages:
index=web
| stats avg(response_time) as avg_response_time by host
eval
Creates or modifies calculated fields.
index=web
| eval total_time=processing_time + network_time
table
Selects fields for display.
index=web
| table _time host status uri
sort
Sorts results.
| sort - count
rex
Uses regular expressions to extract information from raw events.
| rex "user=(?<username>\w+)"
Regex-based extraction is a common topic in Splunk practical assignments because it demonstrates how analysts can turn unstructured text into structured fields.
timechart
Useful for trends over time.
index=web
| timechart count by status
lookup
Allows search results to be enriched with external lookup information.
transaction
Can group related events into transactions when the investigation requires event correlation across multiple records.
The key lesson is not memorizing commands. It is understanding which command solves which analytical problem.
7. Search Optimization Matters
A query that works is not necessarily a good query.
Consider:
index=*
This can search a very broad amount of data.
A more focused search might be:
index=security sourcetype=linux_secure earliest=-24h
Adding an appropriate index, sourcetype and time range can reduce the amount of data that must be examined.
A practical optimization mindset is:
Narrow the data
      ↓
Filter early
      ↓
Extract only what is needed
      ↓
Aggregate intelligently
      ↓
Visualize the result
For Splunk assignment help, this distinction is important. A technically correct query may still deserve improvement if it is unnecessarily broad, difficult to maintain, or inefficient.
8. Field Extraction and Regex in Splunk
Real-world logs are not always neatly structured.
You might encounter an event such as:
2026-09-18 14:25:10 user=student01 src_ip=192.0.2.25 action=login_failed
A search can extract useful information from raw text.
For example:
index=security
| rex "user=(?<user>\S+)"
| rex "src_ip=(?<src_ip>\S+)"
| rex "action=(?<action>\S+)"
| table _time user src_ip action
The result is much easier to analyze:
| Time | User | Source IP | Action | |---|---|---|---| | 14:25:10 | student01 | 192.0.2.25 | login_failed |
This illustrates an important data-analytics concept:
Unstructured machine data can become structured analytical information through field extraction.
That is one reason Splunk appears in cybersecurity, data analytics and log-management coursework.
9. Splunk for Cybersecurity and SIEM
Splunk is strongly associated with security monitoring and SIEM use cases.
A security team may ingest:
- Authentication logs
- Firewall events
- Endpoint alerts
- DNS activity
- Proxy logs
- VPN activity
- Cloud security events
- Identity-provider logs
- Application security events
Once the data is searchable, analysts can investigate questions such as:
Which accounts have repeated failed logins?
Which IP addresses generated unusual activity?
Which systems are producing repeated security errors?
When did suspicious activity begin?
Which events occurred immediately before an alert?
A simple failed-login investigation might begin with:
index=security action=login_failed
| stats count by user src_ip
| sort - count
This does not automatically prove an attack.
It identifies patterns that deserve investigation.
That distinction is essential in cybersecurity: a search result is evidence to evaluate, not automatically a conclusion.
10. Threat Hunting With Splunk
Threat hunting involves proactively searching for suspicious patterns rather than waiting for a security alert to tell you what happened.
A simplified workflow might be:
Hypothesis
   ↓
Identify relevant data
   ↓
Write SPL search
   ↓
Filter and extract fields
   ↓
Find anomalies
   ↓
Correlate evidence
   ↓
Investigate
   ↓
Document findings
For example, a student could investigate repeated authentication failures followed by a successful login:
index=security
(action=login_failed OR action=login_success)
| stats count(eval(action="login_failed")) as failures
        count(eval(action="login_success")) as successes
        by user src_ip
| where failures >= 5 AND successes >= 1
The result is a starting point for investigation—not proof of compromise.
A good Splunk SIEM assignment should explain why a particular detection rule was selected, what its limitations are, and how false positives could occur.
11. Dashboards: Turning SPL Into a Story
Searching data is only one part of the job.
A dashboard turns multiple searches into a visual monitoring experience.
A cybersecurity dashboard might contain:
- Total security events
- Failed login count
- Top source IPs
- Top targeted accounts
- Events by severity
- Activity over time
- Geographic indicators
- Recent alerts
An IT operations dashboard might show:
- CPU utilization
- Error rates
- Application response times
- Server availability
- Request volume
- Infrastructure alerts
The important design principle is:
A dashboard should answer a question, not simply display as many charts as possible.
For a Splunk dashboard assignment, start with the analytical question.
For example:
Question: Are authentication failures increasing?
Then choose visualizations that directly support the answer:
Time-series chart
        +
Failed-login total
        +
Top source IP table
        +
Top affected accounts
This is much stronger than creating unrelated charts simply because the dashboard supports them.
12. Alerts and Monitoring
Splunk can also support alerting workflows.
An alert can be based on a search condition, threshold or schedule.
For example:
index=security action=login_failed
| stats count by src_ip
| where count > 20
A scheduled search could identify source addresses producing an unusually high number of failures.
The next step might be an alert action, depending on the environment and configuration.
A good alert should answer four questions:
- What happened?
- Why does it matter?
- Who needs to know?
- What should happen next?
Poor alerts create noise.
Good alerts provide enough context for someone to investigate.
This concept is important for both Splunk cybersecurity assignments and real-world SOC design.
13. Splunk Enterprise Security and IT Service Intelligence
Splunk can be extended beyond basic searching and dashboards.
Splunk Enterprise Security
Splunk Enterprise Security is designed for security operations and provides capabilities for security monitoring, investigation and detection workflows.
Academic projects may use concepts such as:
- Notable events
- Security detections
- Risk-oriented investigation
- Asset and identity context
- Threat intelligence
- Security dashboards
Splunk IT Service Intelligence
Splunk IT Service Intelligence, commonly abbreviated ITSI, focuses on monitoring services and IT operations.
It can be used to understand:
- Service health
- Infrastructure dependencies
- Operational KPIs
- Service-level indicators
- Event and alert relationships
These areas can make excellent topics for advanced Splunk project help, especially when an assignment requires connecting raw events to higher-level operational outcomes.
14. A Practical Splunk Assignment Workflow
A strong Splunk assignment should follow a repeatable process.
1. Understand the question
          ↓
2. Inspect the dataset
          ↓
3. Identify index and sourcetype
          ↓
4. Establish a time range
          ↓
5. Build a basic SPL search
          ↓
6. Extract required fields
          ↓
7. Aggregate and analyze
          ↓
8. Validate the results
          ↓
9. Build visualizations
          ↓
10. Document findings
Step 1: Understand the question
Do not begin by writing random SPL.
Translate the assignment into an analytical question.
For example:
Identify the five source IP addresses responsible for the highest number of failed authentication attempts during the specified period.
This immediately suggests:
- authentication data
- source IP
- failed-login condition
- time range
- counting
- sorting
- top five results
Step 2: Inspect the data
Determine what indexes and sourcetypes contain the relevant information.
Step 3: Start with a small search
Begin with a query that proves the data exists.
index=security
| head 20
Step 4: Add filters
index=security action=login_failed
Step 5: Aggregate
index=security action=login_failed
| stats count by src_ip
| sort - count
| head 5
Step 6: Validate
Check whether the results make sense.
Step 7: Visualize
Turn the final analytical result into a suitable table, chart or dashboard panel.
Step 8: Explain
A good report should explain what the result means, not merely paste a screenshot.
15. Common Splunk Assignment Mistakes
Mistake 1: Searching the wrong index
If the data is in index=security but the query targets another index, the search can appear broken even when Splunk is working correctly.
Mistake 2: Ignoring sourcetype
Different data formats may require different parsing and field assumptions.
Mistake 3: Using an unnecessarily broad time range
Large searches can increase resource consumption and make troubleshooting harder.
Mistake 4: Treating field names as universal
A field such as src_ip may exist in one dataset but not another.
Always inspect the actual data.
Mistake 5: Writing SPL without explaining it
A university marker usually needs to understand your reasoning.
Mistake 6: Creating dashboards before validating searches
A dashboard built on incorrect searches simply makes incorrect results look attractive.
Mistake 7: Treating every anomaly as an incident
Unusual activity requires investigation and context.
Mistake 8: Ignoring false positives
Security detections often need tuning.
A high number of failed logins could indicate an attack, but it could also result from a misconfigured application, a user repeatedly entering the wrong password, or an automated service using stale credentials.
16. How to Approach Splunk Lab and Project Work
When completing a Splunk lab assignment, separate the work into four layers.
Layer 1: Environment
Make sure the Splunk instance, data source and required configuration are functioning.
Layer 2: Data
Confirm that events are arriving and that fields are available.
Layer 3: Search
Develop and test SPL queries incrementally.
Layer 4: Interpretation
Explain what the results mean and what they do not prove.
This structure makes troubleshooting much easier.
If a dashboard is empty, for example, do not immediately rebuild the dashboard.
Trace the problem backwards:
Dashboard
   ↓
Panel search
   ↓
SPL result
   ↓
Fields
   ↓
Events
   ↓
Index
   ↓
Data ingestion
This is a useful diagnostic habit for Splunk homework help and practical labs alike.
17. Splunk Assignment Help: What Students Commonly Need
Students searching for Splunk Assignment Help often need support with more than one technical issue.
Common requirements include:
- Understanding Splunk architecture
- Installing or configuring a lab environment
- Setting up a Universal Forwarder
- Sending logs to an indexer
- Creating indexes
- Understanding source and sourcetype
- Writing SPL searches
- Using regular expressions
- Extracting fields
- Aggregating events with
stats - Creating time-based charts
- Building dashboards
- Configuring alerts
- Investigating security events
- Writing a technical report
- Explaining search results
- Troubleshooting empty search results
- Preparing screenshots and evidence
For students in Australia, searches such as Splunk Assignment Help Australia, Splunk homework help Australia, Splunk project help Australia, and Splunk university assignment help Australia often reflect the same underlying need: understanding how to connect practical Splunk work with an academic assessment.
The most useful form of assistance is educational: understanding the workflow, testing your own queries, interpreting results and documenting the reasoning behind the solution.
18. Splunk for Computer Science, Cybersecurity and Data Analytics Students
Splunk is valuable academically because it sits at the intersection of multiple disciplines.
Computer Science
Students can explore:
- Data processing
- Distributed systems
- Query languages
- Log parsing
- System architecture
- Performance optimization
Cybersecurity
Students can explore:
- SIEM
- Security monitoring
- Threat hunting
- Authentication analysis
- Incident investigation
- Detection engineering
Data Analytics
Students can explore:
- Data aggregation
- Field extraction
- Statistical summaries
- Time-series analysis
- Visualization
- Pattern discovery
Networking
Students can analyze:
- Firewall logs
- DNS activity
- VPN events
- Network device logs
- Authentication traffic
- Application requests
This makes Splunk a particularly useful practical platform for multidisciplinary IT coursework.
19. How to Write a Strong Splunk Project Report
A technically correct project can still be poorly communicated.
A strong report should make the investigation easy to follow.
A useful structure is:
1. Objective
Explain the problem being investigated.
2. Environment
Describe the Splunk platform, data source and relevant configuration.
3. Dataset
Explain what the logs represent.
4. Methodology
Describe the searches and analytical process.
5. SPL Queries
Include the important searches and explain their purpose.
6. Results
Present tables, screenshots or visualizations.
7. Interpretation
Explain what the results indicate.
8. Limitations
Discuss missing data, false positives, assumptions and other constraints.
9. Recommendations
Explain reasonable next steps.
10. Conclusion
Summarize what the investigation established.
This structure works particularly well for a Splunk university assignment because it demonstrates both technical execution and analytical reasoning.
20. A Small End-to-End Splunk Example
Imagine a dataset containing authentication events:
_time
user
src_ip
action
The investigation question is:
Which source IP addresses generated the most failed authentication attempts?
Start with:
index=security action=login_failed
Then aggregate:
index=security action=login_failed
| stats count by src_ip
Sort:
index=security action=login_failed
| stats count by src_ip
| sort - count
Limit the result:
index=security action=login_failed
| stats count by src_ip
| sort - count
| head 10
Then visualize the result.
This simple progression demonstrates an important principle:
Build searches incrementally.
Instead of writing a complicated query immediately, verify each stage.
21. KnowledgeBoost Quick Reference
| Splunk concept | What it means | Why it matters |
|---|---|---|
| Data source | System generating machine data | Provides raw evidence |
| Forwarder | Collects and forwards data | Moves data into the platform |
| Universal Forwarder | Lightweight forwarding component | Efficient data collection |
| Indexer | Processes and stores indexed data | Makes large datasets searchable |
| Search head | Coordinates searches and user interaction | Provides the analysis layer |
| Index | Logical data storage location | Helps organize and scope searches |
| Source | Origin of an event | Identifies where data came from |
| Sourcetype | Describes event format/type | Supports correct parsing |
| SPL | Splunk Search Processing Language | Searches and transforms data |
| stats | Aggregates results | Counts, averages and summarizes |
| eval | Calculates or modifies fields | Creates analytical fields |
| rex | Extracts data using regex | Converts raw text into fields |
| timechart | Produces time-series results | Reveals trends |
| Dashboard | Collection of visualizations | Communicates insights |
| Alert | Triggered response to a condition | Supports monitoring |
| SIEM | Security monitoring and analysis approach | Supports detection and investigation |
| Enterprise Security | Security-focused Splunk solution | Supports SOC workflows |
| ITSI | IT service monitoring capability | Connects events to service health |
22. Final Takeaway
Splunk is much more than a place to search log files.
It provides a way to move from:
Raw machine data
      ↓
Collection
      ↓
Indexing
      ↓
Search
      ↓
Field extraction
      ↓
Aggregation
      ↓
Visualization
      ↓
Detection
      ↓
Investigation
      ↓
Action
For students, the most important lesson is to understand the entire pipeline.
A strong Splunk assignment should not simply contain a long SPL query. It should demonstrate why the data was selected, how the search was constructed, how the results were validated, what the visualization communicates, and what conclusions can reasonably be drawn.
If you are working on a Splunk lab assignment, Splunk SIEM assignment, Splunk dashboard project, Splunk cybersecurity assignment, or Splunk data analytics project, approach it as an analytical problem rather than a syntax exercise.
Start with the question.
Understand the data.
Build the search incrementally.
Validate the result.
Visualize only what matters.
And, most importantly, explain what the evidence actually tells you.
KnowledgeBoost Perspective
Splunk is a particularly useful technology to learn because it teaches a transferable skill: turning large amounts of technical data into structured evidence and decisions.
That skill extends beyond Splunk.
The same thinking appears in cybersecurity investigations, cloud monitoring, DevOps, observability, incident response, data analytics and modern IT operations.
For students, therefore, learning Splunk is not simply about memorizing SPL commands. It is about learning how to ask better questions of data—and how to support the answers with evidence.