RStudio Explained: From R Code to Complete Data Science Projects
Data science is rarely just about writing a few lines of code. A real analysis usually involves importing data, understanding variables, cleaning messy records, transforming datasets, exploring patterns, creating visualizations, running statistical models, checking assumptions, documenting decisions, and communicating the final result.
This is where RStudio becomes extremely useful.
RStudio is an integrated development environment (IDE) built around R and designed to make data analysis, programming, visualization, reporting, debugging, package development and project organization easier. The current RStudio IDE also supports workflows involving Python, Quarto, version control and other tools used in modern data science.
For students, RStudio is particularly important because it brings an entire analytical workflow into one environment. A university assignment may require you to import a CSV file, clean missing values, create ggplot2 visualizations, perform a regression, interpret the output and submit a reproducible report. RStudio can support every stage.
That also explains why students searching for RStudio Assignment Help, R programming assignment help, R data analysis assignment help, or RStudio project help Australia often encounter challenges that are broader than programming syntax.
The real challenge is understanding the complete workflow.
1. What Is RStudio?
RStudio is an IDE for working with R and data-science projects.
The distinction between R and RStudio is important.
R is the programming language and statistical computing environment.
RStudio is the development environment that gives you tools for writing, executing, debugging, organizing and documenting R work.
A simplified model is:
R
↓
Programming + Statistics + Data Analysis

RStudio
↓
Editor + Console + Projects + Packages + Plots + Debugging + Reporting
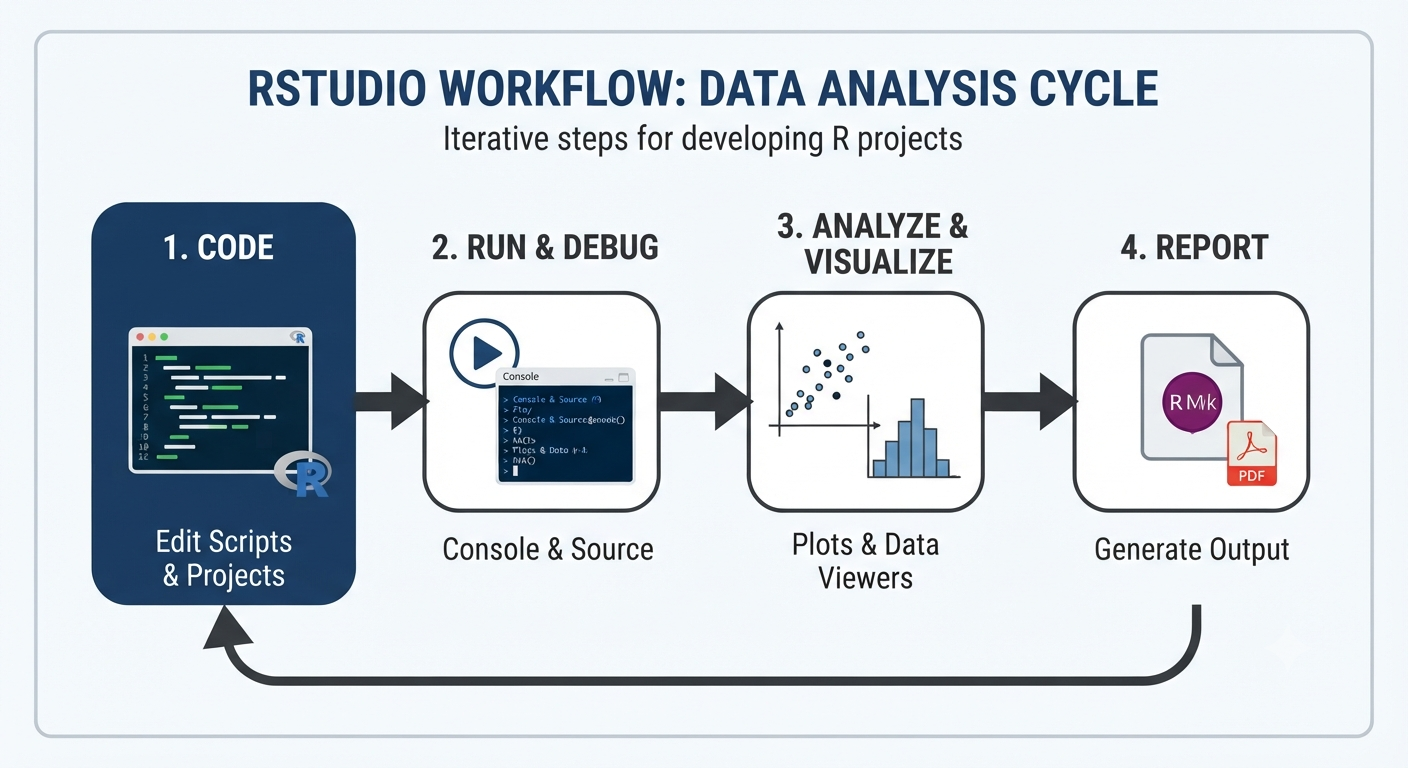
RStudio's interface includes a source editor, console, environment and output areas, along with tools for plots, help, debugging, packages, projects and documentation.
This makes RStudio useful for:
- Data analysis
- Statistics
- Data visualization
- Machine learning
- Research
- Reporting
- Programming
- Reproducible workflows
- Academic projects
- R package development
A beginner may initially think of RStudio as simply "where I type R code." A better way to understand it is as a workspace for the complete analytical lifecycle.
2. Understanding the RStudio Interface
When you first open RStudio, the interface can look complicated. The important areas are easier to understand if you think about what each one does.
Source pane
The Source pane is where you write and edit scripts and documents.
sales <- read.csv("sales.csv")
summary(sales)
Keeping code in a script is usually preferable to typing everything directly into the console because the analysis can be saved, reviewed and rerun.
Console
The Console executes R commands immediately.
2 + 2
returns:
4
The console is useful for experimentation and quick tests.
Environment
The Environment pane shows objects currently available in the R session.
For example:
sales
model
summary_table
may appear after your code creates them.
Plots and Files
Charts generated by R can be viewed in the Plots pane, while the Files pane provides convenient navigation through the project directory.
Packages and Help
The Packages pane helps inspect and manage installed R packages, while integrated help makes it easier to look up functions and documentation.
Understanding these panes is one of the first things students need when learning RStudio for beginners.
3. RStudio Projects: The Foundation of a Clean Workflow
One of the most useful features of RStudio is the Project.
Instead of placing scripts, datasets, exported charts and reports randomly across your computer, a project provides a structured working environment.
A typical project might look like:
customer-analysis/
│
├── customer-analysis.Rproj
├── data/
│   ├── customers.csv
│   └── transactions.csv
├── scripts/
│   ├── import.R
│   ├── cleaning.R
│   └── analysis.R
├── output/
│   ├── figures/
│   └── tables/
└── report/
    └── analysis.qmd
RStudio Projects establish a project-specific working context and can be created from a new directory, an existing directory or a version-control repository.
This matters because reproducibility starts with organization.
A common beginner problem is code such as:
read.csv("C:/Users/Student/Desktop/final-final-data.csv")
That path may work on one computer and fail everywhere else.
A project-oriented workflow makes relative paths and organized folders much easier to manage.
For RStudio project assignments, project organization should therefore be treated as part of the technical solution, not an optional extra.
4. Installing and Managing R Packages
One of R's greatest strengths is its package ecosystem.
Packages provide additional functions, datasets and tools for specialized tasks.
For example:
install.packages("ggplot2")
Then:
library(ggplot2)
The difference is important:
install.packages()installs a package.library()loads an installed package into the current R session.
Common packages used in data-science coursework include:
library(dplyr)
library(tidyr)
library(ggplot2)
library(readr)
library(stringr)
library(lubridate)
Together, packages such as these form parts of the broader tidyverse ecosystem.
RStudio also provides package-development and package-management tooling. A reproducible project should document its package dependencies rather than assuming another computer has exactly the same environment.
5. Importing Data in RStudio
Almost every data-science project begins with data.
The data might come from:
- CSV files
- Excel spreadsheets
- Databases
- APIs
- JSON files
- Statistical software files
- Text files
- Cloud or remote sources
RStudio includes an Import Dataset interface for common formats, while R packages such as readr, readxl, haven, arrow and data.table provide programmatic import options.
For example:
library(readr)

sales <- read_csv("data/sales.csv")
For Excel:
library(readxl)

sales <- read_excel("data/sales.xlsx")
The important principle is reproducibility.
If you use a graphical import wizard, inspect the generated code and keep the code in your project where appropriate. That makes the process easier to reproduce.
This is particularly important for R data analysis assignments, where a marker may need to understand how the dataset entered the analysis.
6. Data Cleaning: The Part Students Often Underestimate
Real-world data is rarely perfect.
You may encounter:
- Missing values
- Duplicate rows
- Inconsistent capitalization
- Incorrect data types
- Invalid dates
- Outliers
- Unexpected categories
- Typographical errors
- Empty strings
- Inconsistent units
Suppose a dataset contains:
Age
21
22
NA
19
"twenty"
Before statistical analysis, you need to understand what the variable actually represents.
A simple inspection might begin with:
str(data)
summary(data)
head(data)
Missing values can be examined with:
colSums(is.na(data))
With dplyr, filtering and transformation become expressive:
library(dplyr)

clean_data <- data |>
  filter(!is.na(age)) |>
  mutate(age_group = case_when(
    age < 25 ~ "Under 25",
    age < 35 ~ "25-34",
    TRUE ~ "35+"
  ))
The important lesson is that data cleaning is analytical reasoning.
Deleting rows without understanding why they are missing can change the results. Replacing missing values with arbitrary values can introduce bias. Converting a variable to a different type can affect downstream calculations.
A strong R data cleaning assignment therefore explains the decisions, not just the code.
7. Data Wrangling With dplyr
Data wrangling is one of the most common uses of R.
The dplyr package provides functions for common operations.
filter()
data |>
  filter(region == "Australia")
select()
data |>
  select(customer_id, revenue, region)
mutate()
data |>
  mutate(profit_margin = profit / revenue)
arrange()
data |>
  arrange(desc(revenue))
summarise()
data |>
  summarise(
    average_revenue = mean(revenue, na.rm = TRUE),
    total_revenue = sum(revenue, na.rm = TRUE)
  )
group_by()
data |>
  group_by(region) |>
  summarise(
    average_revenue = mean(revenue, na.rm = TRUE)
  )
These operations form the backbone of many R programming assignments and R data analysis projects.
8. Data Visualization With ggplot2
One of the major reasons students learn RStudio is data visualization.
The ggplot2 package provides a powerful grammar for constructing charts.
A scatter plot:
library(ggplot2)

ggplot(data, aes(x = advertising, y = sales)) +
  geom_point()
A line chart:
ggplot(data, aes(x = date, y = sales)) +
  geom_line()
A bar chart:
ggplot(data, aes(x = category, y = revenue)) +
  geom_col()
A histogram:
ggplot(data, aes(x = age)) +
  geom_histogram()
The key idea is that a chart should answer a question.
For example:
- How does revenue change over time?
- Which category has the largest sales?
- Is there a relationship between advertising and revenue?
- How is age distributed?
- Are there unusual observations?
A visually attractive chart that does not communicate a meaningful relationship is not necessarily a good visualization.
This is an important distinction in ggplot2 assignment help and R visualization assignment help.
9. Exploratory Data Analysis in RStudio
Before building sophisticated models, analysts usually explore the data.
Exploratory Data Analysis, or EDA, can involve:
Inspect structure
     ↓
Check missing values
     ↓
Summarize variables
     ↓
Explore distributions
     ↓
Visualize relationships
     ↓
Identify anomalies
     ↓
Form hypotheses
Typical R functions include:
summary(data)
str(data)
table(data$category)
mean(data$value, na.rm = TRUE)
sd(data$value, na.rm = TRUE)
Visualization can reveal patterns that summary statistics hide.
For example, two groups might have the same average but completely different distributions.
This is why EDA is a critical part of RStudio data science assignments.
10. Statistical Analysis With RStudio
R is widely used for statistics.
Depending on the course, students may encounter:
- Descriptive statistics
- Correlation
- t-tests
- ANOVA
- Chi-square tests
- Linear regression
- Logistic regression
- Time-series analysis
- Non-parametric tests
A simple correlation:
cor(data$hours_studied, data$score, use = "complete.obs")
A linear regression:
model <- lm(score ~ hours_studied, data = data)

summary(model)
The important part is not simply obtaining a p-value.
A strong statistical analysis should consider:
- Research question
- Variable types
- Model assumptions
- Sample characteristics
- Effect size
- Uncertainty
- Interpretation
- Limitations
For example, a correlation does not automatically establish causation.
Similarly, statistical significance does not necessarily mean that an effect is practically important.
These distinctions matter in R statistics assignment help and university data-analysis projects.
11. Regression Analysis in R
Regression is a common topic in R coursework.
Suppose you want to investigate whether advertising expenditure is associated with sales.
A simple model could be:
model <- lm(
  sales ~ advertising,
  data = data
)

summary(model)
You might then inspect:
plot(model)
The coefficient tells you how the expected outcome changes with the predictor under the model.
But a responsible analysis also asks:
- Are the residuals reasonable?
- Are there influential observations?
- Is the relationship approximately linear?
- Are variables measured appropriately?
- Are important predictors missing?
- Is multicollinearity an issue?
- How generalizable are the results?
This is where an R regression assignment becomes more than a coding exercise.
12. RStudio for Machine Learning
RStudio can also support machine-learning workflows.
Depending on the course, students may work with:
- Classification
- Regression
- Clustering
- Decision trees
- Random forests
- Support vector machines
- Feature engineering
- Model evaluation
- Cross-validation
A general workflow is:
Data
 ↓
Cleaning
 ↓
Feature engineering
 ↓
Train / test split
 ↓
Model training
 ↓
Prediction
 ↓
Evaluation
 ↓
Interpretation
A classification project might evaluate:
- Accuracy
- Precision
- Recall
- F1 score
- ROC-AUC
- Confusion matrix
The biggest mistake is treating model accuracy as the only important metric.
The appropriate evaluation method depends on the problem.
This makes RStudio useful for machine learning assignments, but students still need to understand the underlying methodology.
13. R Markdown: Combining Code, Results and Explanation
A major strength of the R ecosystem is reproducible reporting.
R Markdown allows users to combine:
- Narrative text
- R code
- Tables
- Figures
- Statistical results
- References
A document might contain:
## Revenue Analysis

The following analysis examines monthly revenue.

```{r}
summary(data$revenue)
The distribution is visualized below.
ggplot(data, aes(x = revenue)) +
  geom_histogram()
The result is a report where the analysis and explanation live together.

This is particularly valuable for university work because it reduces the gap between "my code" and "my report."

Instead of manually copying every chart from RStudio into a document, the report can be rendered from the analysis itself.

## 14. Quarto and RStudio

RStudio also supports **Quarto**, an open-source scientific and technical publishing system.

Quarto can be used to create:

- Reports
- Articles
- Presentations
- Websites
- Books
- Dashboards
- Reproducible research documents

RStudio provides editing and preview support for Quarto documents, including rendering workflows.

A basic Quarto workflow looks like:

```text
.qmd file
   ↓
R / Python / other code
   ↓
Render
   ↓
HTML / PDF / DOCX / other output
For students, Quarto can be especially useful when an assignment requires both narrative explanation and executable analysis.
A good Quarto assignment keeps the analysis reproducible rather than treating the final document as a manually assembled artifact.
15. Debugging R Code in RStudio
Everyone writing R eventually encounters errors.
Common messages include:
object 'x' not found
or:
could not find function
or:
unexpected symbol
Debugging should be systematic.
Step 1: Read the error
Do not immediately rewrite the entire script.
Step 2: Identify the failing line
Run smaller pieces of code.
Step 3: Inspect objects
ls()
str(data)
names(data)
Step 4: Check package loading
If a function cannot be found:
library(dplyr)
may be required.
Step 5: Check data types
str(data)
Step 6: Reproduce the smallest failing example
This often makes the problem much easier to understand.
RStudio includes interactive debugging tools designed to help diagnose and fix errors.
For RStudio lab help, learning to debug is far more valuable than simply copying a corrected script.
16. Git and Version Control With RStudio
Data-analysis projects often evolve.
You may create:
analysis_v1.R
analysis_v2.R
analysis_final.R
analysis_final_really_final.R
Version control provides a much better solution.
Git allows you to track changes to:
- R scripts
- Quarto documents
- R Markdown files
- Project configuration
- Documentation
- Supporting code
RStudio includes integration with version-control systems, making it possible to work with repositories from within the IDE.
A basic workflow is:
Edit
 ↓
Review
 ↓
Commit
 ↓
Push
 ↓
Collaborate
For group projects, version control can be particularly useful because it provides a history of changes rather than relying on files being passed between students.
17. Building Shiny Applications With RStudio
R is not limited to static analysis.
The Shiny framework allows developers to create interactive web applications using R.
A simplified Shiny application contains:
User Interface
      +
Server Logic
      ↓
Interactive Application
Possible applications include:
- Interactive dashboards
- Data exploration tools
- Statistical calculators
- Business reporting interfaces
- Research applications
A student project might allow users to choose a region and immediately update a visualization.
That turns a static analysis into an interactive data product.
For RStudio project help, Shiny can be an excellent advanced topic because it connects statistics, programming, visualization and user interaction.
18. A Complete RStudio Data Science Workflow
A strong RStudio project can follow this sequence:
1. Define the question
          ↓
2. Create an RStudio Project
          ↓
3. Import data
          ↓
4. Inspect structure
          ↓
5. Clean and transform
          ↓
6. Explore the data
          ↓
7. Visualize patterns
          ↓
8. Build statistical / ML models
          ↓
9. Validate results
          ↓
10. Document findings
          ↓
11. Render the report
          ↓
12. Save and version the project
The workflow is important because skipping early stages can create problems later.
For example:
Bad data
   ↓
Bad transformation
   ↓
Bad model
   ↓
Beautiful chart
   ↓
Misleading conclusion
Good data science works in the opposite direction:
Good question
   ↓
Good data understanding
   ↓
Careful transformation
   ↓
Appropriate analysis
   ↓
Validated results
   ↓
Clear communication
19. How to Approach an RStudio Assignment
Students searching for RStudio Assignment Help often begin with the code.
A better approach is to begin with the assessment question.
Step 1: Identify the objective
What is the assignment actually asking you to determine?
Step 2: Identify the variables
Which variables are outcomes, predictors, categories or identifiers?
Step 3: Understand the dataset
Use:
str(data)
summary(data)
head(data)
Step 4: Plan the analysis
Decide whether the task requires:
- Descriptive statistics
- Visualization
- Statistical testing
- Regression
- Classification
- Clustering
- Time-series analysis
Step 5: Build the analysis incrementally
Do not write hundreds of lines before checking whether the first ten work.
Step 6: Validate
Check missing values, assumptions, outliers and results.
Step 7: Communicate
Explain what the result means.
This workflow is especially useful for R programming assignment help Australia, R data science assignment help, and R statistics assignment help because it connects implementation with academic reasoning.
20. Common RStudio Assignment Mistakes
Mistake 1: Hard-coding file paths
Avoid machine-specific paths whenever possible.
Mistake 2: Skipping data inspection
Never assume the dataset has the structure you expect.
Mistake 3: Removing missing values without explanation
Missingness can be informative.
Mistake 4: Creating charts without a question
Every visualization should communicate something meaningful.
Mistake 5: Reporting statistical significance without interpretation
A p-value is not the complete story.
Mistake 6: Ignoring assumptions
Statistical methods have assumptions that should be considered.
Mistake 7: Copying code without understanding it
Code that works is not necessarily code you can explain or defend.
Mistake 8: Manually assembling the final report
Reproducible documents can reduce errors and make analysis easier to update.
Mistake 9: Saving everything in one giant script
Separating import, cleaning, analysis and reporting can make a project easier to understand.
Mistake 10: Failing to document packages and dependencies
Someone reproducing the analysis needs to know what tools it uses.
21. RStudio Assignment Help: What Students Commonly Need
A student looking for RStudio Assignment Help may actually need assistance with several different tasks.
Common areas include:
- Understanding the RStudio interface
- Creating RStudio Projects
- Installing R packages
- Importing CSV and Excel files
- Cleaning datasets
- Handling missing values
- Transforming variables
- Using
dplyr - Creating
ggplot2charts - Performing statistical tests
- Running regression models
- Building machine-learning models
- Interpreting output
- Debugging R code
- Creating R Markdown reports
- Creating Quarto documents
- Building Shiny applications
- Using Git with RStudio
- Preparing a reproducible project report
For Australian students, related searches may include RStudio Assignment Help Australia, R programming assignment help Australia, RStudio homework help Australia, RStudio project help Australia, R university assignment help, R data analysis assignment help Australia, and data science assignment help Australia.
The useful goal is not simply to produce code. It is to understand the analysis well enough to explain, test and reproduce it.
22. How to Write a Strong RStudio Project Report
A good R project report should connect the question, methodology, results and interpretation.
A useful structure is:
1. Introduction
Explain the problem and why it matters.
2. Dataset
Describe the source, variables, observations and limitations.
3. Data Preparation
Explain cleaning, transformation and missing-value decisions.
4. Exploratory Analysis
Present meaningful summary statistics and visualizations.
5. Methodology
Explain the statistical or machine-learning methods used.
6. Results
Present the analytical output.
7. Interpretation
Explain what the results mean.
8. Limitations
Discuss assumptions, data limitations and uncertainty.
9. Conclusion
Return to the original research question.
10. Reproducibility
Explain the project structure, packages and report-generation workflow where relevant.
This approach makes the submission easier to evaluate because the reader can follow the reasoning from question to conclusion.
23. A Small End-to-End R Example
Suppose a dataset contains student study hours and examination scores.
The question is:
Is study time associated with examination performance?
First inspect:
str(data)
summary(data)
Visualize:
library(ggplot2)

ggplot(data, aes(x = study_hours, y = score)) +
  geom_point()
Fit a model:
model <- lm(score ~ study_hours, data = data)

summary(model)
Then interpret the output.
A responsible conclusion would not simply say:
"Study hours cause higher scores."
Instead, it would distinguish association from causation and discuss the limitations of the dataset and model.
This small example captures the broader RStudio workflow:
Question
   ↓
Inspect
   ↓
Visualize
   ↓
Model
   ↓
Evaluate
   ↓
Interpret
24. RStudio vs R: A Quick Comparison
| Area | R | RStudio | |---|---|---| | Core role | Programming/statistical environment | Integrated development environment | | Code execution | Yes | Yes, through R | | Console | Yes | Integrated | | Script editor | Basic environment capabilities | Full IDE editor | | Project management | Through packages/tools | Built-in Projects | | Visualization | R packages/functions | Integrated plotting workflow | | Debugging | R capabilities | Integrated debugging tools | | Package development | Supported | Dedicated IDE tooling | | Git integration | Via tools/packages | Integrated workflow | | R Markdown | Supported | Integrated editing/rendering workflow | | Quarto | Supported | Integrated editing/rendering workflow | | Shiny | Supported | Convenient development environment | | Python workflows | Possible through ecosystem | Current IDE supports Python workflows |
The simplest way to remember it is:
R is the engine. RStudio is the workspace around the engine.
25. KnowledgeBoost Quick Reference
| RStudio concept | What it does | Why it matters |
|---|---|---|
| R | Programming and statistical environment | Executes analytical code |
| RStudio IDE | Development environment | Organizes the complete workflow |
| Project | Project-specific working context | Improves organization and reproducibility |
| Console | Executes commands interactively | Useful for testing |
| Source pane | Edits scripts and documents | Keeps analysis reusable |
| Environment | Shows current objects | Helps inspect session state |
| Packages | Extend R functionality | Add specialized capabilities |
| dplyr | Data transformation | Supports data wrangling |
| ggplot2 | Visualization | Builds analytical charts |
| R Markdown | Dynamic reporting | Combines narrative and analysis |
| Quarto | Technical publishing | Creates reproducible documents and sites |
| Git | Version control | Tracks project changes |
| Shiny | Interactive web applications | Turns analysis into interactive tools |
| lm() | Linear modelling | Supports regression analysis |
| summary() | Summarizes objects/models | Helps inspect results |
| str() | Shows object structure | Essential for data inspection |
| is.na() | Detects missing values | Supports data cleaning |
26. Final Takeaway
RStudio is more than an editor for R code.
It provides a structured environment for:
Data
 ↓
Import
 ↓
Cleaning
 ↓
Exploration
 ↓
Visualization
 ↓
Statistical / ML Analysis
 ↓
Validation
 ↓
Reporting
 ↓
Reproducibility
For students, that complete workflow is the real value.
A strong RStudio assignment should not simply contain a collection of commands. It should demonstrate that you understand the question, the dataset, the analytical method, the assumptions, the results and the limitations.
Whether the task is an R programming assignment, R data analysis project, R statistics assignment, ggplot2 assignment, R Markdown assignment, Quarto project, R machine learning assignment, or RStudio university project, the same principle applies:
Start with the question, understand the data, choose an appropriate method, validate the result, and explain what the analysis actually shows.
KnowledgeBoost Perspective
RStudio is valuable because it encourages a way of working that extends far beyond R itself.
Good data analysis is not just about writing code quickly. It is about building a process that another person can understand, reproduce and evaluate.
That means organizing projects properly, documenting transformations, choosing visualizations deliberately, checking statistical assumptions, keeping code reusable, tracking changes and communicating conclusions honestly.
For students, those are transferable data-science skills—not merely RStudio skills.