Data Mining Tools: A Comprehensive Guide to the Best Tools and Platforms
Whether you are a data science professional looking for the right analytics architecture or a student working on a database management, machine learning, or data mining project, selecting the right data mining tools can have a major impact on the quality, speed, reproducibility, and explainability of your analysis.
Modern organizations generate enormous quantities of data through websites, applications, enterprise databases, financial systems, sensors, customer interactions, scientific experiments, and social platforms. Finding useful patterns in these datasets manually is impractical.
Data mining software helps transform raw data into useful information by supporting activities such as data preparation, classification, clustering, regression, association-rule mining, anomaly detection, feature selection, visualization, and predictive modeling.
This guide examines some of the most useful data mining tools and platforms, explains what each tool is designed for, compares their strengths and limitations, and provides a practical framework for choosing the right platform for academic projects and real-world analytics.
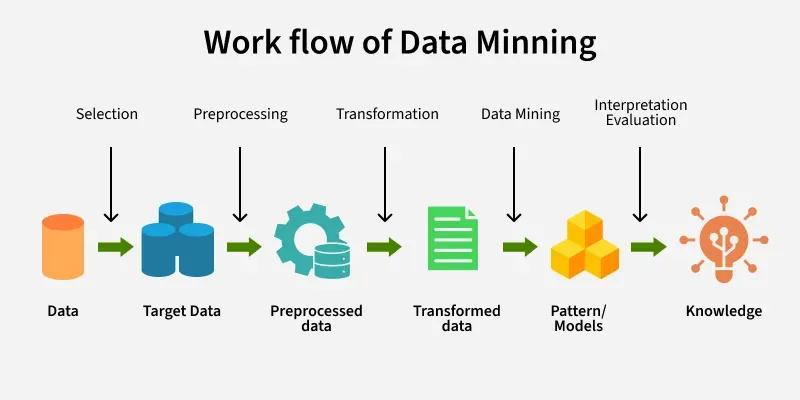 Data mining workflow: raw data is prepared, transformed, analyzed with appropriate algorithms, evaluated, and converted into useful insights.
What Is Data Mining?
Data mining is the process of discovering useful patterns, relationships, trends, anomalies, and other meaningful information from datasets. It is closely associated with the broader process known as Knowledge Discovery in Databases (KDD). Data mining is not simply about applying an algorithm. It involves understanding the data, preparing it correctly, selecting appropriate methods, validating results, and interpreting the resulting knowledge. A typical data mining workflow involves:
- Understanding the analytical problem.
- Collecting relevant data.
- Cleaning and preprocessing the data.
- Exploring the dataset.
- Selecting useful attributes and features.
- Applying suitable data mining algorithms.
- Evaluating the results.
- Visualizing and interpreting patterns.
- Communicating findings and supporting decisions. Common data mining tasks include:
- Classification
- Regression
- Clustering
- Association-rule mining
- Anomaly detection
- Feature selection
- Pattern recognition
- Customer segmentation
- Fraud detection
- Recommendation systems
- Predictive analytics
- Sequential pattern analysis The algorithms themselves are only one part of the process. The software environment used to prepare, analyze, visualize, evaluate, and deploy models can be equally important.
Why Are Data Mining Tools Important?
Working with a large dataset involves considerably more than running a machine learning algorithm. Real-world datasets commonly contain:
- Missing values
- Duplicate records
- Incorrect data types
- Outliers
- Inconsistent categorical values
- Noisy observations
- Irrelevant attributes
- Highly imbalanced classes
- Different numerical scales
- Duplicate or near-duplicate entities
- Data collected from incompatible sources A good data mining platform can simplify many of these tasks and make analytical workflows repeatable. A typical workflow looks like this:
             ┌───────────────────────────┐
             │    Raw / Source Data      │
             └─────────────┬─────────────┘
                           │
                           ▼
             ┌───────────────────────────┐
             │ Data Cleaning & ETL       │
             │ Missing values            │
             │ Duplicates                │
             │ Outliers                  │
             └─────────────┬─────────────┘
                           │
                           ▼
             ┌───────────────────────────┐
             │ Data Transformation       │
             │ Scaling                   │
             │ Encoding                 │
             │ Feature Engineering      │
             └─────────────┬─────────────┘
                           │
                           ▼
             ┌───────────────────────────┐
             │ Data Mining / ML          │
             │ Classification            │
             │ Clustering                │
             │ Regression                │
             │ Association Rules         │
             └─────────────┬─────────────┘
                           │
                           ▼
             ┌───────────────────────────┐
             │ Evaluation & Visualization│
             └─────────────┬─────────────┘
                           │
                           ▼
             ┌───────────────────────────┐
             │ Insights & Decisions      │
             └───────────────────────────┘
Key Functions Performed by Data Mining Tools
1. Data cleaning and preprocessing
Tools can help identify missing values, remove duplicates, transform data types, normalize numerical variables, encode categorical attributes, and prepare datasets for analysis.
2. Exploratory data analysis
Before selecting an algorithm, analysts need to understand distributions, correlations, outliers, class imbalance, and relationships between variables.
3. Classification
Classification assigns records to predefined categories. Examples include predicting whether a transaction is fraudulent or whether a customer is likely to churn.
4. Regression
Regression predicts a numerical value, such as sales, demand, revenue, temperature, or house price.
5. Clustering
Clustering discovers naturally occurring groups without requiring predefined labels. Customer segmentation is a common example.
6. Association-rule mining
Association analysis identifies items or events that frequently occur together. Retail market-basket analysis is a classic application.
7. Anomaly detection
Data mining systems can identify observations that differ substantially from normal patterns. This is useful for fraud detection, security monitoring, manufacturing quality control, and operational analytics.
8. Visualization
Charts, graphs, confusion matrices, cluster plots, feature-importance charts, and interactive dashboards make analytical results easier to understand.
Top Data Mining Tools and Platforms in 2026
There is no single best data mining tool for every situation. The right choice depends on the size of the dataset, the type of analysis, the user's programming ability, deployment requirements, budget, and whether the work is academic or production-oriented. The following platforms represent several major approaches to data mining: visual workflow systems, programming ecosystems, distributed processing engines, statistical platforms, and database-integrated tools.
1. RapidMiner / Altair RapidMiner
RapidMiner, now associated with the Altair analytics ecosystem, is a visual data science and analytics platform built around workflow-oriented data preparation, modeling, and analysis. Its visual approach allows users to construct analytical pipelines without writing every operation manually in code.
Best for
- Enterprise analytics teams
- Business analysts
- Visual workflow development
- Predictive analytics
- Users who want less code-heavy model development
Important capabilities
- Visual workflow construction
- Data preparation
- Machine learning workflows
- Model evaluation
- Automated analytics capabilities
- Integration with broader enterprise analytics environments
Advantages
- Low barrier to entry for visual users
- Workflows are relatively easy to inspect
- Useful for demonstrating complete analytics pipelines
- Suitable for rapid experimentation
Limitations
- Commercial capabilities can involve licensing costs
- Large workflows may become difficult to maintain
- Advanced users may prefer programmatic control RapidMiner can be particularly useful when the goal is to demonstrate the complete data-mining process visually rather than focus entirely on programming.
2. KNIME
KNIME, short for Konstanz Information Miner, is a popular visual analytics platform based on modular nodes. A KNIME workflow is constructed by connecting nodes that perform operations such as importing data, cleaning records, transforming variables, training models, evaluating results, and exporting outputs.
Best for
- Visual data pipelines
- Data preparation
- Reproducible workflows
- Data blending
- Analytics experimentation
- Users who want to combine GUI workflows with Python or R
Key features
- Node-based workflow design
- Data preprocessing
- Machine learning integration
- Visualization
- Database connectivity
- Python and R integration
- Extensible workflow architecture
Advantages
- Strong visual representation of analytical pipelines
- Good for teaching workflow concepts
- Supports complex multi-step processes
- Can integrate coding into otherwise visual workflows
Limitations
- Very large workflows can become visually complex
- Advanced functionality requires learning the platform's workflow model
- Enterprise capabilities may depend on the specific deployment and licensing arrangement KNIME is one of the strongest choices when workflow transparency and modularity are important.
3. WEKA
WEKA (Waikato Environment for Knowledge Analysis) is one of the best-known educational data mining and machine learning environments. Developed at the University of Waikato, WEKA provides a graphical interface as well as Java-based APIs. It includes many classical machine learning algorithms and remains particularly useful for teaching data mining concepts.
Best for
- University coursework
- Data mining laboratories
- Algorithm demonstrations
- Academic experimentation
- Beginners learning classical machine learning
Common WEKA tasks
- Classification
- Regression
- Clustering
- Association-rule mining
- Attribute selection
- Data preprocessing
- Model evaluation A typical WEKA workflow is:
Load Dataset
     │
     ▼
Preprocess
     │
     ▼
Select Algorithm
     │
     ├── Classification
     ├── Clustering
     ├── Association
     └── Attribute Selection
     │
     ▼
Run Experiment
     │
     ▼
Evaluate Results
WEKA's GUI can be especially useful when a student needs to demonstrate concepts such as decision trees, Naive Bayes, k-means clustering, association rules, or feature selection without first building a complete programming environment.
Advantages
- Free and widely used for education
- Straightforward GUI
- Strong collection of classical algorithms
- Excellent for demonstrating theoretical concepts
- Supports ARFF and common tabular data formats
Limitations
- Not designed as a modern distributed Big Data platform
- GUI and workflow can feel dated compared with newer tools
- Less suitable for production-scale data engineering For DBMS and data mining coursework, WEKA remains a practical learning environment.
4. Python: Pandas, Scikit-learn and Modern ML Libraries
Python is not a single data mining application. It is a programming ecosystem containing a large collection of libraries used throughout the data science and machine learning workflow. Important libraries include:
- pandas for tabular data manipulation
- NumPy for numerical computing
- scikit-learn for classical machine learning and preprocessing
- SciPy for scientific computing
- Matplotlib for visualization
- Seaborn for statistical visualization
- PyTorch for deep learning
- TensorFlow for machine learning and deep learning workflows
Best for
- Custom data mining pipelines
- Machine learning development
- Research
- Automation
- API-backed analytics
- Production software
- Advanced experimentation A simplified Python workflow might look like:
import pandas as pd
from sklearn.model_selection import train_test_split
from sklearn.preprocessing import StandardScaler
from sklearn.ensemble import RandomForestClassifier
data = pd.read_csv("dataset.csv")
X = data.drop(columns=["target"])
y = data["target"]
X_train, X_test, y_train, y_test = train_test_split(
    X, y, test_size=0.20, random_state=42
)
scaler = StandardScaler()
X_train_scaled = scaler.fit_transform(X_train)
X_test_scaled = scaler.transform(X_test)
model = RandomForestClassifier(random_state=42)
model.fit(X_train_scaled, y_train)
predictions = model.predict(X_test_scaled)
The example illustrates the general workflow rather than representing a universally correct preprocessing strategy. In a real project, preprocessing choices depend on the dataset and algorithm.
Advantages
- Extremely flexible
- Large open-source ecosystem
- Strong community support
- Excellent integration with databases and cloud platforms
- Suitable for automation and production systems
Limitations
- Requires programming knowledge
- Users must design the workflow themselves
- Dependency and environment management can become complex For users who want maximum control, Python is usually one of the strongest choices.
5. R
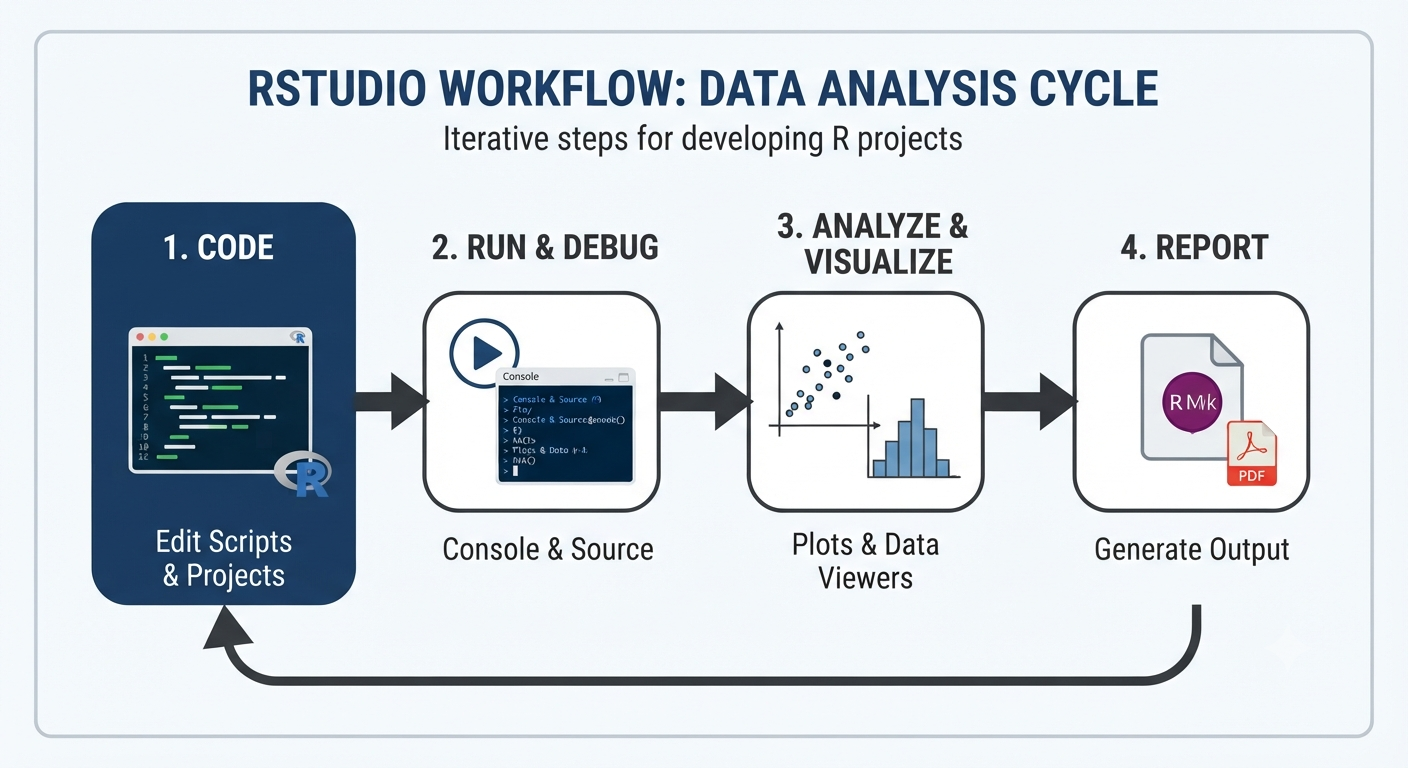
R is a programming language and environment designed around statistics, data analysis, and visualization. It is especially popular in academic research, statistics, econometrics, bioinformatics, and analytical environments where statistical methodology and publication-quality visualization are important.
Best for
- Statistical analysis
- Academic research
- Experimental data analysis
- Econometrics
- Visualization
- Statistical modeling Common R packages and ecosystems include:
tidyverseggplot2dplyrtidyrcaretrandomForestdata.tableforecastand modern time-series packages
Advantages
- Excellent statistical ecosystem
- Strong visualization capabilities
- Widely used in research
- Extensive package ecosystem
Limitations
- Requires programming knowledge
- Large in-memory datasets can require careful resource management
- Production software integration may be less straightforward for some teams than Python R is particularly attractive when statistical analysis and research reporting are central to the project.
6. Apache Spark and Spark MLlib
Apache Spark is a distributed computing framework designed for processing large datasets across clusters. Its machine learning component, MLlib, provides scalable algorithms and utilities for data preparation and machine learning.
Best for
- Large-scale data processing
- Distributed analytics
- Enterprise data lakes
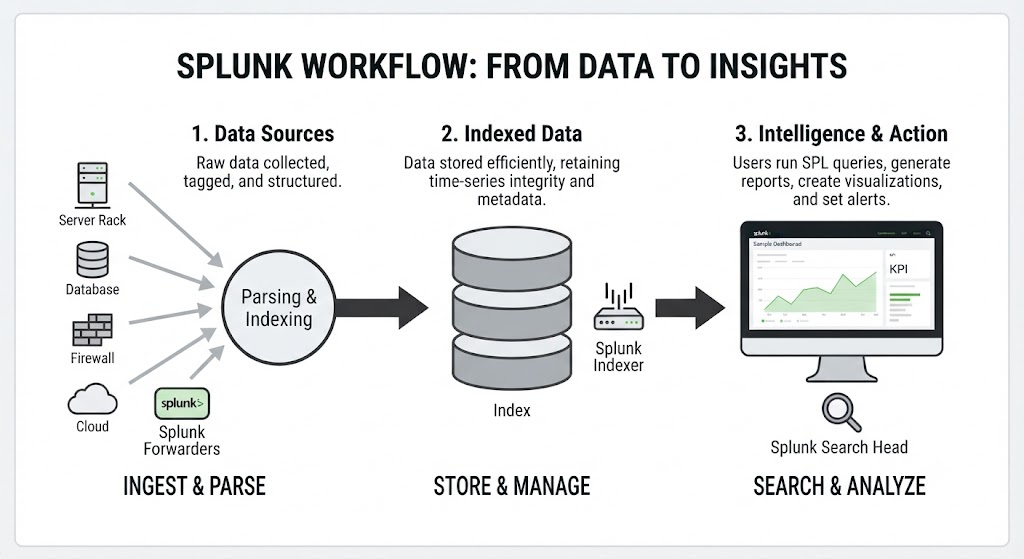
- High-volume log analysis
- Large datasets that exceed the practical capacity of a single-machine workflow Spark supports APIs for multiple languages, including Python, Scala, Java, and SQL. A simplified architecture is:
             Large Distributed Dataset
                       │
                       ▼
              ┌─────────────────┐
              │ Apache Spark    │
              └────────┬────────┘
                       │
          ┌────────────┼────────────┐
          ▼            ▼            ▼
      Worker 1      Worker 2      Worker 3
          │            │            │
          └────────────┼────────────┘
                       ▼
               Aggregated Results
Advantages
- Distributed processing
- Strong integration with data engineering systems
- Supports large-scale transformations
- Useful for batch and streaming-oriented architectures
Limitations
- More complex than desktop data mining tools
- Cluster infrastructure can introduce operational overhead
- Not necessary for small datasets Spark should not automatically be selected merely because a dataset is called "Big Data." If a dataset can be analyzed efficiently on a single machine, a simpler tool may be more appropriate.
7. SAS
SAS provides a broad commercial analytics ecosystem used extensively in enterprise environments. SAS platforms have historically been important in banking, insurance, healthcare, government, risk management, and other sectors where governance, statistical modeling, auditing, and enterprise support are important.
Best for
- Enterprise analytics
- Risk modeling
- Regulated industries
- Statistical analysis
- Governance-heavy environments
Strengths
- Mature enterprise ecosystem
- Strong statistical capabilities
- Enterprise support
- Governance and deployment options
Limitations
- Proprietary licensing
- Higher cost than many open-source alternatives
- Requires familiarity with the SAS ecosystem SAS can make sense when an organization already has significant SAS infrastructure and expertise.
8. Orange Data Mining
Orange Data Mining is an open-source visual programming environment designed around interactive workflows and widgets. Users can connect widgets to load data, visualize distributions, build models, evaluate results, and explore patterns.
Best for
- Beginners
- Students
- Classroom demonstrations
- Exploratory analysis
- Visual learners
Advantages
- Very approachable GUI
- Interactive visualizations
- Minimal coding required
- Useful for demonstrating algorithms
Limitations
- Not intended to replace large-scale distributed data platforms
- Advanced automation may require other tools
- Complex production pipelines generally benefit from more programmable environments Orange is a strong option when visual exploration and learning matter more than enterprise-scale deployment.
9. IBM SPSS Modeler
IBM SPSS Modeler is a visual data science and predictive analytics platform aimed largely at business and enterprise users. Its interface allows users to create data preparation, modeling, and evaluation workflows using a visual approach.
Best for
- Business analytics
- Customer analytics
- Churn prediction
- Predictive modeling
- Organizations already using IBM analytics infrastructure
Strengths
- Visual workflow
- Enterprise integration
- Strong analytics heritage
- Designed to make predictive modeling accessible to non-programmers
Limitations
- Commercial licensing
- Proprietary ecosystem
- Less attractive for users who prefer fully open-source workflows
10. Oracle Data Mining / Oracle Machine Learning
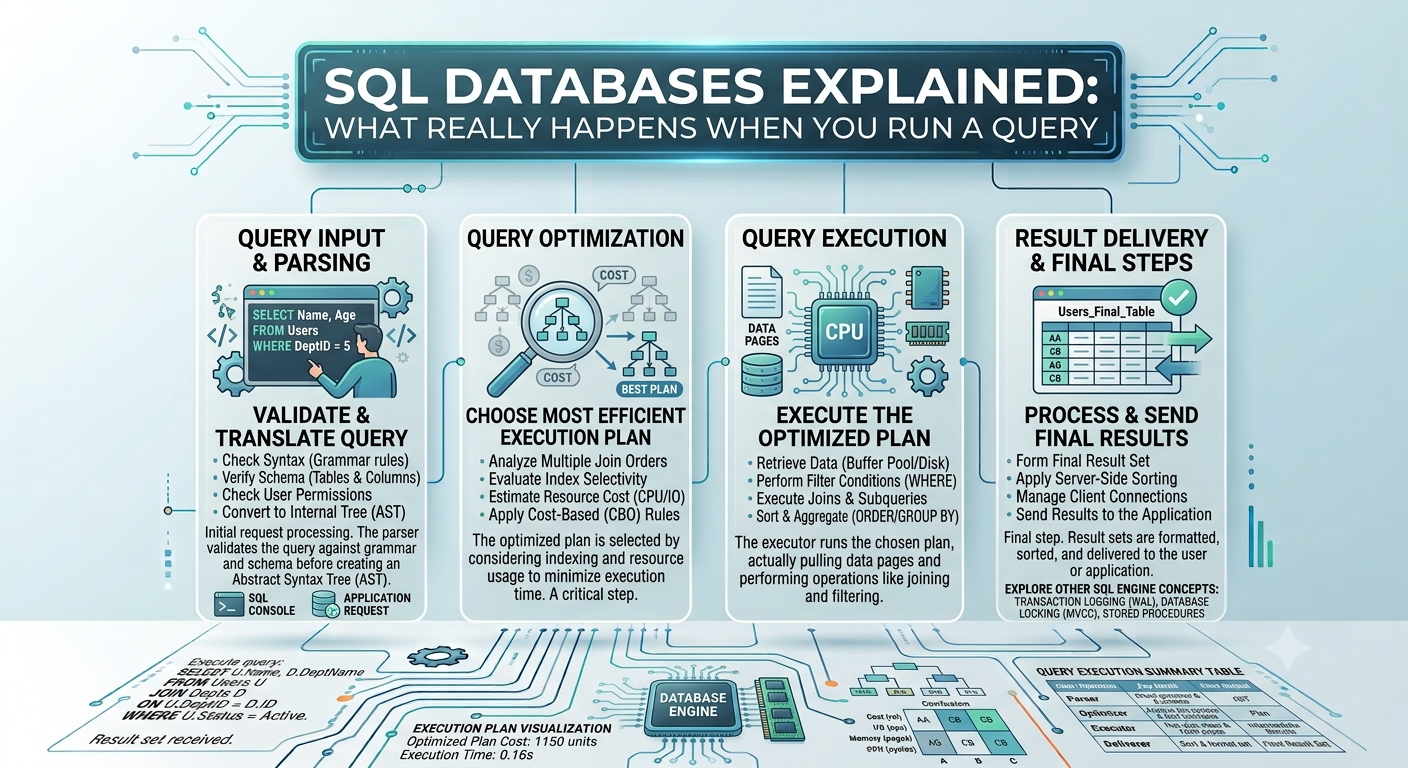
Oracle provides machine learning capabilities that can operate close to Oracle Database data through its Oracle Machine Learning ecosystem. The major architectural advantage of in-database analytics is that organizations can reduce unnecessary movement of data between database systems and external analytics environments.
Best for
- Organizations heavily invested in Oracle Database
- In-database analytics
- Enterprise database environments
- SQL-oriented analytics teams
Advantages
- Can analyze data close to where it is stored
- Reduces some data movement
- Fits naturally into Oracle-centric architectures
Limitations
- Strong dependency on Oracle infrastructure
- Not the best general-purpose choice for every data source
- Licensing and platform considerations can be significant The modern Oracle ecosystem should be evaluated rather than assuming that older standalone Oracle Data Miner terminology represents the complete current product landscape.
Data Mining Tools Comparison
The following comparison focuses on the role each platform typically plays rather than declaring one tool universally superior. | Tool | General approach | Coding level | Strongest use cases | Scale | |---|---|---:|---|---| | RapidMiner | Visual analytics platform | Low–Moderate | Enterprise analytics and visual workflows | Medium–Large | | KNIME | Visual node-based platform | Low–Moderate | Data preparation and modular workflows | Medium–Large | | WEKA | GUI + Java | Low–Moderate | Education and classical data mining | Small–Medium | | Python | Programming ecosystem | Moderate–High | Custom ML and production analytics | Small–Large | | R | Statistical programming | Moderate–High | Statistics and research | Small–Large | | Apache Spark | Distributed computing | Moderate–High | Big Data processing | Large–Very Large | | SAS | Enterprise analytics | Moderate | Regulated enterprise analytics | Large | | Orange | Visual programming | Very Low–Moderate | Learning and exploration | Small–Medium | | IBM SPSS Modeler | Visual enterprise analytics | Low–Moderate | Business predictive analytics | Medium–Large | | Oracle Machine Learning | In-database analytics | Moderate | Oracle-centric environments | Medium–Large |
Open-Source vs Commercial Data Mining Tools
One of the first decisions when selecting a data mining platform is whether to use an open-source ecosystem or a commercial product.
Open-source tools
Examples include:
- Python
- R
- KNIME
- WEKA
- Orange
- Apache Spark Open-source software can provide substantial flexibility and may have no traditional software license cost for the core platform. However, "free" does not mean that there are no costs. Organizations may still need to account for:
- Infrastructure
- Cloud computing
- Development time
- Training
- Maintenance
- Security
- Support
- Deployment
Commercial platforms
Examples include enterprise offerings from vendors such as Altair, IBM, SAS, and Oracle. Commercial platforms may provide:
- Vendor support
- Enterprise governance
- Integration
- Security controls
- Deployment infrastructure
- Centralized administration
- Commercial SLAs The right decision therefore depends on the total cost of ownership rather than simply the software license price.
Visual Tools vs Code-Based Tools
Another important distinction is the way users construct analytical workflows.
Visual workflow tools
KNIME, Orange, RapidMiner, and SPSS Modeler allow users to construct workflows visually. They are particularly useful when:
- Teaching concepts
- Communicating workflows to non-programmers
- Building repeatable visual pipelines
- Rapidly experimenting with different operations
Code-based tools
Python and R provide direct programmatic control. They are especially useful when:
- Algorithms need customization
- Workflows must be automated
- Models must integrate with software
- Experiments need version control
- APIs or production systems are involved
Distributed platforms
Apache Spark occupies a different category because its primary advantage is distributed processing. The important point is that these categories are not mutually exclusive. A real enterprise architecture may combine SQL, Python, Spark, visualization tools, cloud infrastructure, and database systems.
How to Choose the Right Data Mining Tool
Selecting the correct platform depends on several factors.
1. Dataset size
For a small CSV file, WEKA, Orange, Python, or R may be more than sufficient. For very large datasets distributed across multiple machines, Spark or another distributed analytics architecture may be more appropriate.
2. Programming experience
If you are new to data mining, visual tools such as WEKA and Orange can reduce the initial programming burden. If you are comfortable coding, Python or R provides considerably more flexibility.
3. Type of analysis
Choose according to the analytical problem:
- Classification → WEKA, Python, R, KNIME, Spark
- Regression → Python, R, SAS, KNIME, WEKA
- Clustering → Python, R, WEKA, Orange, Spark
- Association rules → WEKA, Python, R, specialized platforms
- Large-scale processing → Spark
- Statistical research → R or SAS
- Visual exploration → Orange or KNIME
4. Deployment requirements
A university assignment may only require an executable analysis and screenshots. A production system may require:
- Version control
- Testing
- APIs
- Monitoring
- Model governance
- Security
- CI/CD
- Cloud deployment The latter requirements generally favor programmatic and enterprise-oriented platforms.
5. Budget
Students and individual researchers often benefit from open-source tools. Organizations may select commercial platforms because the cost of licensing is offset by support, governance, integration, and operational requirements.
A Practical Decision Guide
A simple decision process can help narrow the choices:
                    What is your primary goal?
                              │
              ┌───────────────┴───────────────┐
              │                               │
          Academic                         Production
              │                               │
       ┌──────┴──────┐                ┌───────┴────────┐
       │             │                │                │
    No-code        Coding        Standard scale    Big Data
       │             │                │                │
   WEKA/Orange    Python/R       KNIME/Python      Spark
For students and beginners
Start with WEKA or Orange if the objective is to understand fundamental data mining concepts.
For programming-oriented projects
Choose Python when you need custom pipelines, machine learning integration, automation, or software deployment.
For statistical research
Choose R when statistical analysis, experimentation, and publication-quality visualization are central requirements.
For visual enterprise workflows
Consider KNIME or another enterprise visual analytics platform.
For distributed Big Data
Consider Apache Spark when the workload genuinely requires distributed processing.
Data Mining Tools for Students and Academic Projects
Students often encounter data mining tools in courses such as:
- Data Mining
- Database Management Systems
- Machine Learning
- Artificial Intelligence
- Data Science
- Big Data Analytics
- Business Intelligence For academic work, the best tool is not necessarily the most powerful tool. A good academic tool should make it possible to:
- Load a dataset.
- Explain preprocessing.
- Select an algorithm.
- Configure meaningful parameters.
- Execute the model.
- Evaluate the output.
- Interpret the results.
- Document the experiment.
Why WEKA is still useful for coursework
WEKA is particularly convenient for classical data mining assignments because many algorithms can be demonstrated through its GUI. A student can document:
- Dataset characteristics
- Preprocessing filters
- Algorithm selection
- Parameter settings
- Training/test split
- Accuracy
- Confusion matrix
- Precision
- Recall
- F-measure
- ROC analysis This can make the relationship between theoretical concepts and actual model output easier to demonstrate.
When Python is better for a student project
Python becomes preferable when an assignment requires:
- Custom preprocessing
- Data visualization
- Larger datasets
- Multiple experiments
- Machine learning pipelines
- Integration with SQL
- Automation
- Custom algorithms
Mastering Data Mining Assignments: A Practical Approach
A good data mining assignment should demonstrate reasoning rather than simply report an accuracy number.
1. Business or research understanding
Clearly state the problem. Are you trying to:
- Predict a category?
- Predict a numerical value?
- Find groups?
- Discover associations?
- Detect anomalies? The analytical objective should determine the algorithm.
2. Data understanding
Describe:
- Number of rows
- Number of attributes
- Data types
- Target variable
- Missing values
- Class distribution
- Potential outliers
3. Data preprocessing
Common operations include:
Missing-value handling
Depending on the dataset, missing values may be removed, replaced with statistical estimates, or handled using model-specific techniques.
Categorical encoding
Categorical variables may need to be converted into numerical representations before being used by algorithms that require numerical input.
Scaling
Algorithms based on distances or feature magnitudes can be affected when variables have very different scales. Common methods include:
- Min-Max normalization
- Standardization / Z-score scaling
Feature selection
Removing irrelevant or redundant attributes can improve interpretability and sometimes model performance.
Choosing an Algorithm
The data mining tool is only part of the solution. Algorithm selection matters too. | Problem | Common algorithms | |---|---| | Classification | Decision Tree, Naive Bayes, k-NN, Random Forest, SVM | | Regression | Linear Regression, Regression Trees, Random Forest Regression | | Clustering | k-Means, Hierarchical Clustering, DBSCAN | | Association mining | Apriori, FP-Growth | | Anomaly detection | Isolation Forest, Local Outlier Factor | | Dimensionality reduction | PCA, t-SNE, UMAP | Algorithm choice should be based on the problem, dataset characteristics, interpretability requirements, computational constraints, and evaluation strategy.
Model Evaluation
A model should never be judged solely by one metric.
Classification
Common metrics include:
- Accuracy
- Precision
- Recall
- F1-score
- ROC-AUC
- Confusion matrix For imbalanced datasets, accuracy can be misleading. Precision, recall, F1-score, class-specific metrics, and suitable threshold analysis may provide a more informative evaluation.
Regression
Common metrics include:
- Mean Absolute Error (MAE)
- Mean Squared Error (MSE)
- Root Mean Squared Error (RMSE)
- R²
Clustering
Possible evaluation measures include:
- Silhouette score
- Within-cluster sum of squares
- Davies-Bouldin index However, clustering metrics should be combined with domain interpretation because a mathematically strong cluster structure is not automatically meaningful in a business or scientific context.
Common Mistakes When Using Data Mining Tools
Even sophisticated software cannot compensate for a poorly designed analytical process.
Mistake 1: Choosing the algorithm before understanding the problem
Start with the question and data, not the algorithm.
Mistake 2: Ignoring data leakage
Information from the test set should not accidentally influence model training or preprocessing decisions.
Mistake 3: Using accuracy on highly imbalanced data
A model can achieve high accuracy while performing poorly on the minority class.
Mistake 4: Treating correlation as causation
A data mining system can identify statistical relationships, but those relationships do not automatically establish causal mechanisms.
Mistake 5: Overfitting
A model that performs extremely well on training data may fail on unseen data.
Mistake 6: Ignoring reproducibility
Record:
- Dataset version
- Preprocessing steps
- Algorithm
- Hyperparameters
- Random seed where applicable
- Evaluation procedure
- Software/library versions Reproducibility is particularly important for academic research and professional analytics.
Data Mining vs Machine Learning
The terms data mining and machine learning overlap but are not identical. Data mining is primarily concerned with discovering useful patterns and knowledge from data. Machine learning focuses on algorithms that learn patterns from data for tasks such as prediction, classification, generation, ranking, or decision-making. A data mining project may use machine learning, but it may also involve descriptive statistics, association rules, clustering, database queries, visualization, and other analytical techniques. In practice, modern data science frequently combines all of these areas.
Data Mining Tools and AI
The data mining ecosystem is increasingly influenced by modern AI. Machine learning libraries now support increasingly sophisticated models, while automated machine learning systems can help with:
- Feature engineering
- Model selection
- Hyperparameter optimization
- Model comparison
- Experiment tracking Generative AI can also assist analysts with:
- Writing exploratory SQL
- Explaining code
- Generating documentation
- Suggesting preprocessing strategies
- Debugging scripts
- Summarizing model outputs However, AI-generated analytical code and interpretations still require human validation. An apparently correct query or model can produce misleading results when the underlying data or assumptions are wrong.
Data Mining Tools: Which One Should You Learn First?
There is no universal answer, but a practical progression is:
Beginner
Start with: WEKA → Orange → basic Python This sequence helps build conceptual understanding before introducing more programming.
Intermediate
Move toward: Python + pandas + scikit-learn This combination provides a powerful foundation for practical machine learning and data analysis.
Statistical and research-focused learner
Consider: R + tidyverse + ggplot2 This is especially useful for statistical analysis and academic research.
Enterprise workflow learner
Consider: KNIME Its visual workflow model makes it useful for understanding how individual analytical operations become a complete pipeline.
Big Data learner
After understanding basic data processing, learn: Apache Spark + PySpark Spark becomes much easier to understand after the fundamentals of data processing and machine learning are already clear.
Frequently Asked Questions
What is the easiest data mining tool for beginners?
Orange and WEKA are among the most approachable data mining tools for beginners because their graphical interfaces allow users to perform many common operations without writing extensive code.
Which data mining tool is best for students?
For classical data mining coursework, WEKA is an excellent starting point. Python is generally better when a project requires custom programming, visualization, automation, or integration with other systems.
Is Python a data mining tool?
Python is better described as a programming language and ecosystem used for data mining. Libraries such as pandas, scikit-learn, NumPy, SciPy, and visualization frameworks provide the functionality needed to construct data mining workflows.
Is R better than Python for data mining?
Neither is universally better. Python is particularly strong for software integration, automation, machine learning engineering, and general-purpose development. R is especially strong in statistics, research, and data visualization.
Is Apache Spark necessary for Big Data?
Spark is a major option for distributed data processing, but it is not automatically required for every large dataset. The appropriate architecture depends on data volume, workload, latency requirements, infrastructure, and existing technology.
Which tool is best for association-rule mining?
WEKA, Python libraries, R packages, and several visual data mining platforms can perform association-rule mining. The best choice depends on whether the project prioritizes education, customization, visualization, or production integration.
What is the difference between data mining and machine learning?
Data mining focuses on extracting useful patterns and knowledge from data. Machine learning focuses on algorithms that learn from data to perform tasks such as prediction or classification. The two areas overlap substantially.
Where can I get help with a complex data mining assignment?
If you need help understanding preprocessing, selecting algorithms, configuring WEKA or KNIME, writing Python/R code, evaluating models, or documenting a data mining project, ProjectAssignments.com can provide academic project guidance and technical assistance.
Get Expert Assistance With Data Mining Projects
Complex data mining projects can involve much more than choosing an algorithm. Students may need to clean datasets, configure software, debug code, compare models, interpret evaluation metrics, and document the entire workflow. At ProjectAssignments.com, students can seek guidance with areas such as:
- Data mining
- Database management systems
- Python
- R
- Machine learning
- WEKA
- KNIME
- Data preprocessing
- Model evaluation
- Data visualization
- Academic project documentation The goal should be to understand the methodology, not merely obtain a final output. A strong project explains why a particular preprocessing method, algorithm, metric, and interpretation were selected.
Final Takeaway
The best data mining tool is the one that matches the problem, dataset, technical skill level, and deployment requirements. For beginners and academic coursework, WEKA and Orange provide approachable visual environments. For flexible programming-based workflows, Python and R offer extensive ecosystems. For modular visual pipelines, KNIME is a strong option. For distributed workloads, Apache Spark provides a scalable processing architecture. For enterprise environments, platforms from Altair, IBM, SAS, and Oracle can provide capabilities beyond a basic open-source workflow. The most important lesson is that software does not replace analytical reasoning. A successful data mining project still depends on understanding the data, selecting appropriate methods, preventing leakage and overfitting, evaluating results correctly, and communicating the findings clearly. If you are learning data mining, start with the fundamentals, build small reproducible workflows, and then move toward more advanced programming, distributed processing, and production analytics as your requirements grow.